Your overseas shares are priced in US dollars, pounds or euros, but your tax return is in New Zealand dollars. Somewhere in between, every figure gets converted, and the rate you convert at changes the income you declare. Most people never think about it. For a holding near the $50,000 threshold, or in a year you're using the CV method, that choice can move your tax bill by a few hundred dollars.
Here's what IRD actually lets you pick, and where it makes a difference worth caring about.
Why the exchange rate matters for FIF tax
The FIF calculation only works in NZD. Your opening market value, closing value, dividends and any foreign tax paid all start life in a foreign currency and have to be turned into New Zealand dollars before the maths runs.
IRD publishes its rates as foreign units per 1 NZD, so the conversion is a division: NZD = foreign amount ÷ rate. When the rate is 0.59, US$30,000 becomes about NZ$50,850. When it's 0.62, the same US$30,000 is only NZ$48,390. Same shares, NZ$2,460 apart, just from the rate on the day.
That spread is why the rate isn't a rounding detail. It feeds straight into your FIF income.
The conversion methods IRD allows
Under section EX 57 of the Income Tax Act 2007, when you work out FIF income using FDR, CV, the deemed rate of return or the cost method, you may convert foreign amounts in one of three ways:
- The actual rate for the day each amount applies: the spot rate on the day a market value is measured, or a dividend is paid.
- The mid-month rate, IRD's published rate for the 15th of each month, applied to whichever month each amount falls in.
- The rolling 12-month average rate, still matched to each amount's date, but using the smoothed twelve-month average ending in that month instead of the spot rate on the day.
IRD publishes the mid-month and rolling 12-month average rates itself, both drawn from Reserve Bank of New Zealand wholesale data. For the actual day-by-day rate you can use the figures the RBNZ publishes directly.
In the calculator that comes out as three choices:
| Method | What it uses | Best when |
|---|---|---|
| Actual-day | The real rate on each specific date (RBNZ daily) | You want each figure converted at its true rate |
| Mid-month | IRD's 15th-of-the-month rate nearest each date | The standard, low-fuss choice for most people |
| Rolling 12-month average | A smoothed 12-month average rate for each date | You'd rather smooth out the year's swings |
💡 Good to know: these are different official sources, so they won't reconcile to the cent. IRD's mid-month figures come from Bloomberg wholesale rates; the daily figures come from the RBNZ. A small gap between them is normal, not an error.
Which dates actually get converted
The "actual rate for the day" method isn't one rate. It's a different rate for each part of the calculation, matched to the date that part belongs to:
- Opening market value → the rate on 1 April (start of the tax year)
- Closing market value → the rate on 31 March (end of the year)
- Dividends and foreign tax paid → the date each one was paid
- Buys and sells during the year → the trade date
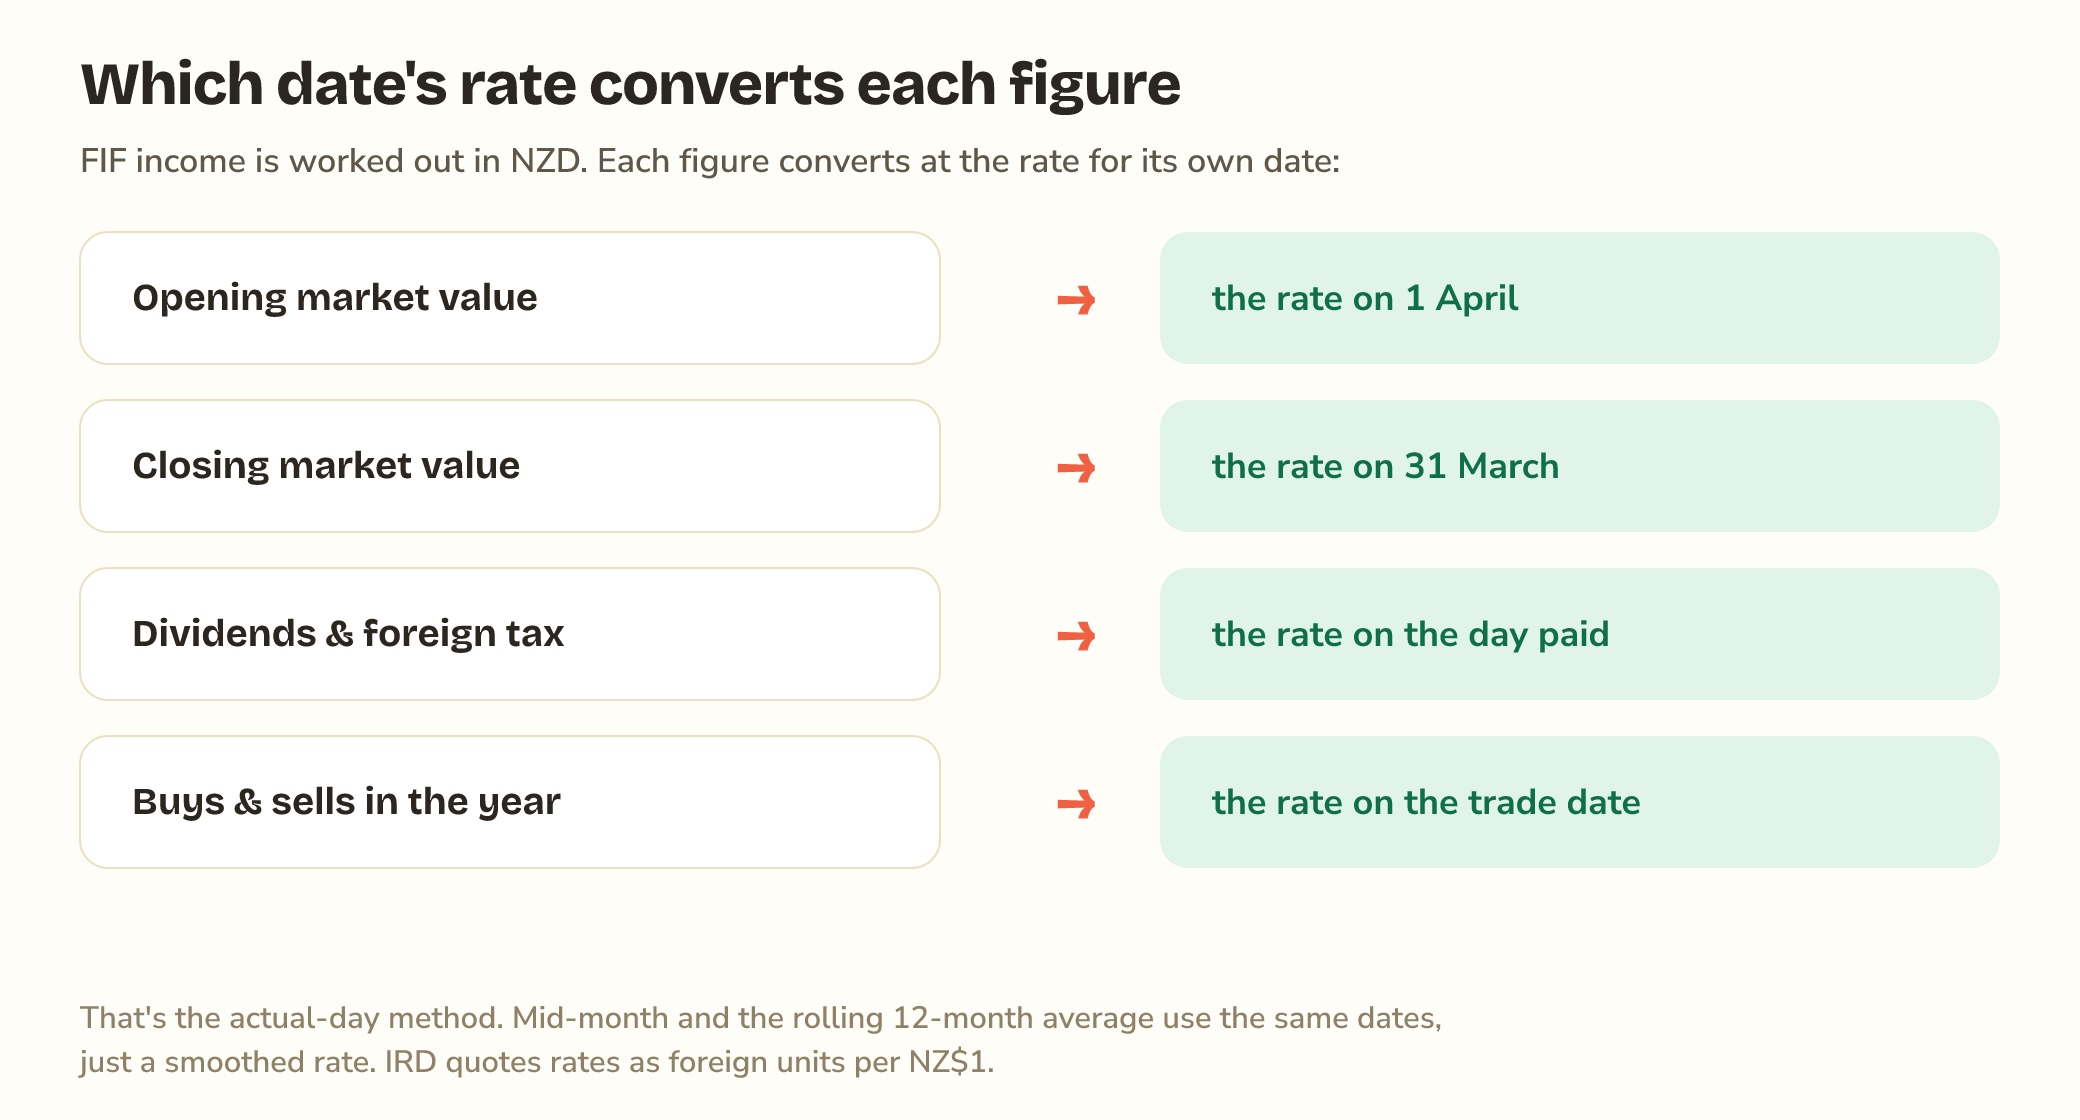
The rolling 12-month average uses those same dates, but converts each one at the average rate over the twelve months ending in that month rather than the spot rate on the day. So it still changes from date to date, just gently, because one sharp swing barely moves a twelve-month average. That's the real difference between the two approaches: the actual-day rate tracks each day's spot, while the rolling average smooths a whole year of them. In a calm year the gap is tiny. In a year the NZD swung hard, it isn't.
Worked example: FDR barely cares
Take a US holding for the 2025/26 year. Opening value on 1 April 2025 is US$30,000; it grows to US$33,000 by 31 March 2026; no dividends. FDR taxes 5% of your opening market value, so only one date matters: 1 April.
| Conversion | Opening value (NZD) | FDR income (5%) |
|---|---|---|
| Mid-month (April, 0.5892) | $50,916.50 | $2,545.82 |
| Rolling 12-month average (April, 0.5925) | $50,632.91 | $2,531.65 |
The two methods land about NZ$14 apart. Because FDR only ever looks at one date, and April's spot rate and its rolling average were close that year, the choice is almost academic. If FDR is your method, don't lose sleep over the rate.
Worked example: CV cares a lot
Now run the same holding through the CV method, which compares closing value against opening value. Suddenly two dates are in play, and they were converted at different rates as the NZD drifted down across the year.
| Conversion | Opening (1 Apr) | Closing (31 Mar) | CV income |
|---|---|---|---|
| Mid-month (0.5892 → 0.5805) | $50,916.50 | $56,847.55 | $5,931.05 |
| Rolling average (0.5925 → 0.5870) | $50,632.91 | $56,218.06 | $5,585.15 |
That's a NZ$346 difference in taxable FIF income from nothing but the conversion method, roughly NZ$114 of tax at a 33% rate. The mid-month approach converts the bigger closing figure at March's weaker spot rate, which inflates the NZD gain; the rolling average, anchored to a full year, smooths it out.
⚠️ Watch out: the average isn't always the winner. It happened to be lower here because the NZD ended the year below its average. Flip the currency's direction and the actual-day method comes out ahead instead. There's no rate that's always cheaper. It depends on how the NZD moved that year.
The takeaway across both examples: which calculation method you use (FDR vs CV) usually swings your tax far more than which rate you convert at. The rate choice earns its keep mainly in CV years and right at the threshold.
The $50k de minimis test shifts with the rate too
Before any of this, the de minimis test checks whether the total cost of your overseas shares stayed under NZ$50,000. That cost is also a converted figure, so the rate decides which side of the line you land on.
US$29,000 of shares looks like this depending on the rate when you bought:
| Rate at purchase | Cost (NZD) | Result |
|---|---|---|
| 0.62 (strong NZD) | $46,774 | Under (no FIF rules) |
| 0.57 (weak NZD) | $50,877 | Over (FIF rules apply) |
You can't pick a flattering rate for a purchase you already made. Cost converts at the rate for the actual trade date. But if you're hovering near NZ$50,000, it's worth converting carefully rather than eyeballing it, because a few cents on the rate is the difference between filing and not.
The catch: you don't get to cherry-pick
This is where the "optimisation" has real limits, and it matters that you know them.
When you elect a conversion method, IRD requires you to apply it to every FIF interest you hold under that calculation method, in that year and every year after. You can't convert one holding at the average and another at the day rate to shave each one down, and you can't flip methods year to year chasing the lower number. IRD also expects you to use the same source consistently and to keep records of the rates you used: source, type and date.
💡 Good to know: the honest way to read all this isn't "find the cheapest rate." It's "pick the method that fits how you invest, apply it consistently, and let it be right." For most people that's the mid-month rate. The savings come from getting the method (FDR vs CV) right, not from rate-shopping.
None of this is tax advice. The rules have exceptions for certain investments and entities, so if real money turns on it, check IR461 or talk to an accountant.
Key takeaways
- FIF income is calculated in NZD, so the conversion rate feeds straight into the result.
- IRD lets you use the actual rate for each date, the mid-month rate, or the rolling 12-month average (a smoothed rate that still moves month to month); mid-month is the standard, low-fuss choice.
- The rate choice barely affects FDR (one date), but can swing CV income by hundreds of dollars (two dates, a moving NZD).
- The $50k de minimis test shifts with the rate too, so convert carefully if you're close.
- You must apply one method across all holdings and keep it consistent year to year. It's a method choice, not a rate-shopping exercise.
- The calculator runs all three rate sources so you can see the difference for your own holdings.
Sources: IRD: Overseas currency conversion to NZ dollars, the Tax Technical determination on foreign currency amounts for CFCs and FIFs, and the IR461 guide. Daily rates are from the RBNZ.
This guide is general information, not tax advice. Always verify figures against IR461 and your year-end statements, and check anything important with a qualified NZ accountant before filing.